MCS 275 Spring 2023 Homework 11
- Course Instructor: Emily Dumas
Instructions:
- Complete the problems below, which ask you to write matplotlib code in a Python notebook.
- Upload the resulting notebook directly to gradescope, i.e. upload the
.ipynbfile containing your work.
Deadline
This homework assignment must be submitted in Gradescope by Noon central time on Tuesday April 4, 2023.
Collaboration
Collaboration is prohibited, and you may only access resources (books, online, etc.) listed below.
Content
This homework is about matplotlib.
Resources you may consult
Most relevant:
- Worksheet 11 Solutions
- Lecture 24 - Julia sets
- Lecture 25 - Matplotlib
- Lecture 26 - Matplotlib 2
- VanderPlas:
- Chapter 2 covers numpy
- Numpy documentation
- Course sample code repo
- Downey's book
- MCS 260 course materials from Fall 2021:
Less likely to be relevant, but also allowed:
- Any other lecture of MCS 275 spring 2023.
- Python tour
- Slides from any lecture of my most recent MCS 260 course MCS 260, Fall 2021.
- Any lecture video posted on our course Blackboard site
- Downey's book
- Any other textbook listed on the course blackboard site under "Textbooks"
Point distribution
This homework assignment has 2 problems, numbered 2 and 3. The grading breakdown is:
| Points | Item |
|---|---|
| 3 | Autograder |
| 6 | Problem 2 |
| 6 | Problem 3 |
| 15 | Total |
The part marked "autograder" reflects points assigned to your submission based on some simple automated checks for Python syntax, etc. The result of these checks is shown immediately after you submit.
What to do if you're stuck
Ask your instructor or TA a question by email, in office hours, or on discord.
Submit as a notebook
Submit your work on this assignment as a notebook file hwk11.ipynb. You can create that notebook from scratch or you can just add your solutions to the notebook file containing the assignment. Do whatever you find most convenient.
Problem 2: Plot from description
Make a figure with a single set of axes. The horizontal axis should be labeled $n$ and the vertical axis should be labeled $y$. Two sets of data should be shown on those axes:
- For integers $n$ from 0 to 20, the points $(n,\log(F_n))$ where $F_n$ is the $n^{\mathrm{th}}$ Fibonacci number, should be marked by blue dots (not joined by lines at all).
- The line $y = c n$ where $c=\log \left ( \frac{1 + \sqrt{5}}{2} \right ) \approx 0.48121182505960347$ is drawn in red, with a thin line width.
Give the plot a title "Log Fibonacci numbers".
Note: The $n^{\mathrm{th}}$ Fibonacci number is quite close to $\left (\frac{1 + \sqrt{5}}{2} \right)^n$, so your plot should show a line and a bunch of dots that are close to that line!
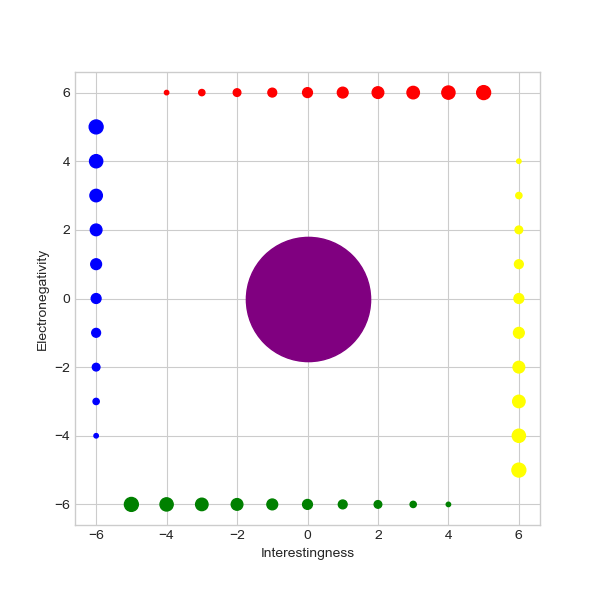
Problem 3: Plot from picture
Write matplotlib code to produce a plot as similar to this one as you can manage. (Including the grid lines you see here is optional; they're the default in the stylesheet recommended in VanderPlas's book.)
Revision history
- 2023-03-31 Initial publication