Lecture 26
Matplotlib II
MCS 275 Spring 2023
Emily Dumas
Lecture 26: Matplotlib II
Reminders and announcements:
- Project 3 due today at 6pm.
- Next big topic is databases
- Spring break next week, no classes or office hours
Gallery
The matplotlib home page has a nice gallery of examples with source code. It can be especially helpful if you know what you want something to look like, but don't know what it is called.
Broadcasting
This figure from §2.5 of Python Data Science Handbook by Jake VanderPlas was made with Matplotlib!
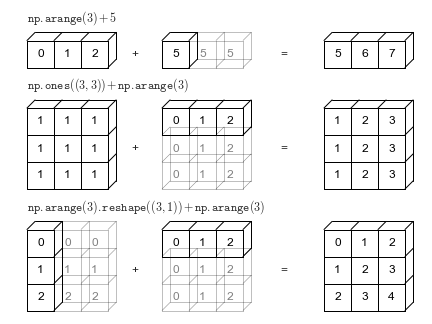
And the book contains the source code!
Today
- Scatter plots
- Contour plots
- Density plots
Main plotting commands
- plt.plot(xvals,yvals,...) — plot line, points, or both
- plt.scatter(xvals,yvals,...) — plot points with individual size/color control
- plt.contour(xgrid,ygrid,zgrid) — contour (topographical) map of function of (x,y)
- plt.imshow(zgrid,extent=[...],origin="lower") — density plot of a grid of values
Most other commands adjust or annotate plots made with these commands.
References
Revision history
- 2022-03-18 Last semester's lecture on this topic finalized
- 2023-03-17 Updated for 2023
Have a great spring break!