Lecture 10
Errors and debugging
MCS 275 Spring 2022
Emily Dumas
Lecture 10: Errors and debugging
Course bulletins:
- Project 1 due Friday at 6pm central
A bug in environments.py
The Project 1 starter pack has a bug in environments.py that makes the simulation behave slightly differently from the project description's claims.
It doesn't affect what you need to do, and I'm not making any changes.
The bug: If one bacterium asks to move to a point P, and during the same time step, a new bacterium is created at P, then both will succeed and P will contain two bacteria.
New unit
Two lectures on debugging.
Today: interpreting error messages and basic methods to fix them
Debugging
Any difference between the expected and actual behavior of a program is an error or bug. Might stop the program, might not.
The process of finding and fixing errors in computer programs is called debugging. It is difficult!
Today we mostly focus on debugging errors that cause a program to stop.
Lines in progress
Functions can call other functions, so at any moment the Python interpreter may have a number of function calls in progress.
        def f(x):
            """Return the square of `x`"""
            return x*x
        print("The square of 8 is",f(8))
e.g. in the program above, when line 3 runs, the function called on line 4 is in progress.
Call stack
The function calls currently underway are stored on the call stack, a data structure maintained by the interpreter.
The top of the stack is the function actively running; the others are waiting on this one to finish.
Just below the top is the function that called the one currently running, and so forth.
Uncaught exceptions
The Python interpreter raises exceptions to signal unexpected conditions. Programs can also raise exceptions themselves.
Unless caught by a try...except block, raising an exception ends the program.
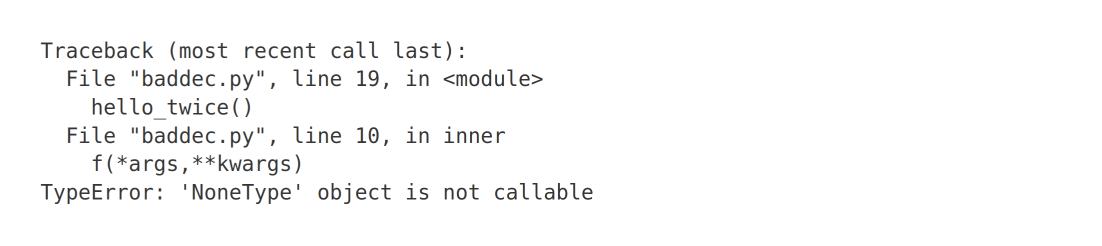
When exiting due to an exception, Python prints a summary of what happened, called a traceback.
Tracebacks contain lots of useful information, including the call stack.
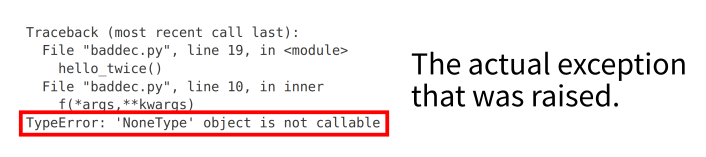
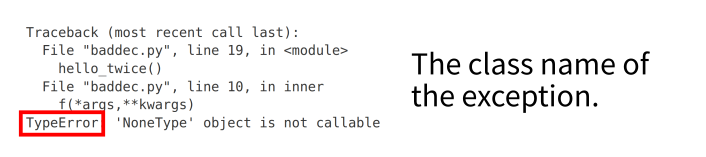
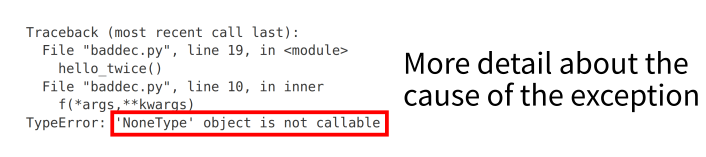
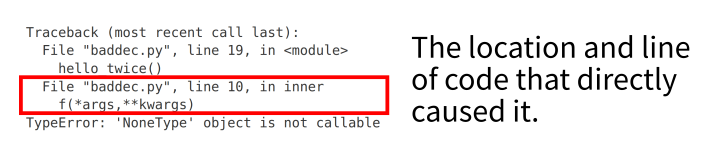
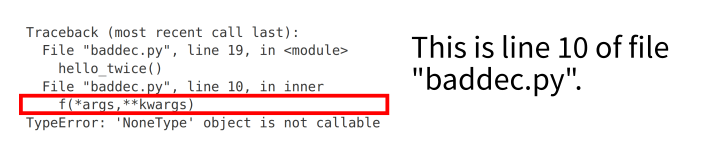
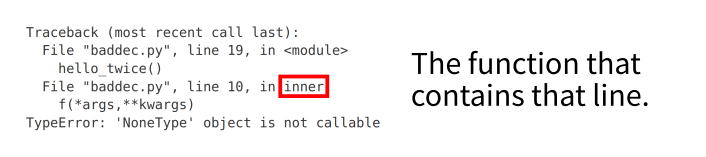
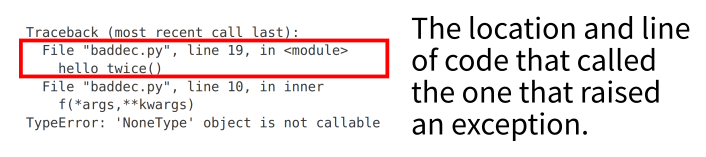
Anatomy of a traceback
What's not in a traceback
- Argument values for each function call
- Values of variables involved in any of the lines shown
- Information about when the exception was raised (e.g. the first time this line ran? the 500th?)
Goal in reading a traceback
Determine where the code's meaning doesn't match the programmer's intentions.
Usually a change is needed near one of the lines in the traceback... but which one?
How to use a traceback
- Generally, read from bottom to top
- Note the exception type, and look it up in the docs if needed
- Focus on files you wrote (even if others appear in traceback)
- Of those, open the one closest to the bottom in an editor and go to the line in question
- Try to develop error hypothesis consistent with the exception
- Check docs or use
help()if the error was in a call to a built-in function - Move up the traceback if you're stuck
Some built-in exception types
...and what they most often mean for debugging.
- NameError - Reference to unknown variable.
- You probably used a variable name before defining it. (Was its definition in a line that didn't execute?)
- AttributeError - Reference to unknown method or attribute (wrong class?)
int("15").strip() - You probably misspelled a method name, or an object wasn't of the type you expected.
- TypeError - Bad argument type, e.g. non-int index
or trying to use indexing on wrong type["a","b"]["foo"] # list index must be an integer
or passing the wrong type to a function or operatorFalse[2] # bool doesn't allow indexing"asdf"**5 # cannot raise str to a power len(5) # integers don't have a length - You should check the types of the variables appearing on the line, because something probably doesn't match your expectations.
- ValueError - Function got the right type, but an inappropriate value
int("space wasps") - You should check the values of the variables appearing on the line, because something probably doesn't match your expectations.
- IndexError - Item requested by integer index does not exist
["a","b"][15] - Check logic that chooses the index; does it account for possibly empty list? Short one?
- KeyError - A dictionary was asked for a key that doesn't exist
{"a": 260, "b":330}["autumn"] - Why do you expect this key to exist? Check actual value of the dict just before that line.
- SyntaxError - Execution couldn't even start because the program's text is not valid Python code.
- Often a forgotten colon or mismatched parenthesis, on or just above the indicated line.
- ImportError or ModuleNotFoundError- The requested module could not be imported (or a requested name wasn't in the module, if using
from) - Typo in module name? Trying to import module from a file not in the current dir? Try having the program print
os.getcwd().
- OSError and its subclasses - The OS was asked to do something, but it failed; includes many file-related errors (e.g. file not found, directory found where file needed, permission problems, ...)
- Look in terminal or file browser at the relevant file/path. Does it exist? Have the program print
os.getcwd()so you know where it looked, if you used a relative path or bare filename.
Debugging strategies
So far: I mostly talked about read-only debugging methods (read and think).
Reality: Debugging is hard. Tracebacks alone often don't give enough information.
Various debugging strategies can be used to help identify and fix problems.
print debugging
One of the oldest debugging strategies is to add extra output to a program.
E.g. print values of arguments and variables just before the line causing an exception.
Disadvantage: Generally need to remove all those scattered print() calls when you're done debugging.
print debugging reputation
Print debugging is often criticized as the refuge of those who don't know any better.
We'll talk about another method next time, so you will know better!
But the simplicity and directness of simply printing more program state is often compelling.
Brian Kernighan (Unix co-creator) called print debugging the “most effective debugging tool” in 1979, and it remains popular more than 40 years later.
References
- Lutz has a very short discussion of debugging methods at the end of Chapter 3.
- Beazley & Jones discusses some debugging methods in Section 14.12.
- Hierarchy of Python's built-in exceptions
Revision history
- 2022-02-02 Initial publication