Topics
The main topics of this worksheet are:
- Pillow
- numpy
The problems are labeled according to which of these topics they cover. Make sure to get some practice with each topic.
The main references for these topics are:
- Lecture 24
- Lecture 25
- Lecture 26
- Pillow tutorial
- Chapter 2 of VanderPlas
Instructions
- Problem 1 is handled differently than the others:
- Tuesday discussion students: Problem 1 will be presented as an example at the start of discussion
- Thursday discussion students: Please complete Problem 1 before discussion and bring your solution
- For the other problems:
- Work on these problems in discussion.
1. Made to order (Pillow and numpy)
A. Here is a 256x256 PNG image:
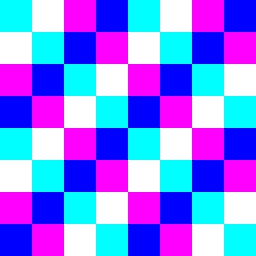
Make a Python script that uses Pillow to create an image that is identical to this one (or as close as you can get).
B. Here is a 16x16 numpy matrix of integers (dtype int64):
array([[-1, -1, -1, -1, -1, -1, -1, -1, -1, -1, -1, -1, -1, -1, -1, -1],
       [20, -1, 30, -1, 40, -1, 50, -1, 60, -1, 70, -1, 80, -1, 90, -1],
       [-1, -1, -1, -1, -1, -1, -1, -1, -1, -1, -1, -1, -1, -1, -1, -1],
       [-1, -1, -1, -1, -1, -1, -1, -1, -1, -1, -1, -1, -1, -1, -1, -1],
       [-1, 10, -1, -1, 10, -1, -1, 10, -1, -1, 10, -1, -1, 10, -1, -1],
       [20, 10, 30, -1, 40, -1, 50, 10, 60, -1, 70, -1, 80, 10, 90, -1],
       [-1, 10, -1, -1, 10, -1, -1, 10, -1, -1, 10, -1, -1, 10, -1, -1],
       [-1, 10, -1, -1, 10, -1, -1, 10, -1, -1, 10, -1, -1, 10, -1, -1],
       [-1, 10, -1, -1, 10, -1, -1, 10, -1, -1, 10, -1, -1, 10, -1, -1],
       [20, 10, 30, -1, 40, -1, 50, 10, 60, -1, 70, -1, 80, 10, 90, -1],
       [-1, 10, -1, -1, 10, -1, -1, 10, -1, -1, 10, -1, -1, 10, -1, -1],
       [-1, 10, -1, -1, 10, -1, -1, 10, -1, -1, 10, -1, -1, 10, -1, -1],
       [-1, -1, -1, -1, -1, -1, -1, -1, -1, -1, -1, -1, -1, -1, -1, -1],
       [20, -1, 30, -1, 40, -1, 50, -1, 60, -1, 70, -1, 80, -1, 90, -1],
       [-1, -1, -1, -1, -1, -1, -1, -1, -1, -1, -1, -1, -1, -1, -1, -1],
       [-1, -1, -1, -1, -1, -1, -1, -1, -1, -1, -1, -1, -1, -1, -1, -1]])
Find a way to produce this matrix and store it in a variable named A.
This is easy to do if you just copy the matrix into your source code. But you can do it with much less code using numpy indexing. (You'll want to examine the matrix carefully to spot all the patterns!) What's the shortest way to do it? I was able to do it in 3 lines, 70 characters total, including newline characters (but not counting the line that imports numpy). Can you do better?
2. Needle in a haystack, part 1 (Pillow)
Download and extract this zip file:
It contains 1024 image files in two directories (haystack1 and haystack2). If you look at them, they all appear to contain black and white "static". These files are used in this problem and the next one.
Let's say that a pixel is bluish if its blue component is larger than its red or green components. So, for example, (62,30,62) is not bluish, but (5,6,7) is bluish.
The files in directory haystack1 are numbered 000 to 511. They are PNG image files, all of the same size. Among all of these image files, there is only a single bluish pixel. Which file is it in, and at what location?
3. Needle in a haystack, part 2 (Pillow)
This is a more complex version of the previous problem. Only work on it if you will still have enough time to do the numpy problems below. (If unsure, skip ahead for now and come back to this later.)
The files in directory haystack2 have 36-character filenames (plus an extension ".png"), and have varying sizes. They contain a secret message, which you can decode as follows:
Examine all of the image files in alphabetical order. In each one, look for bluish pixels. There may be no bluish pixels at all, or a single one, or many of them. Whenever a bluish pixel is found, let (x,y) be its position and let r be the remainder of dividing x+y by 36. Take the character in the filename that appears at index r. If that character is a digit, ignore it. Otherwise, add that character to the end of the message.
Hint: It may be helpful to use os.listdir from the os module. It takes a directory name and returns a list of filenames in that directory.
4. Max, Min, Mean and RMS (numpy)
Download and unzip this file to obtain a single CSV file:
It has no header row. There are 30 rows of data, each of which has 10,000 fields which are floating-point numbers.
Read the file and put each line into a numpy vector. Then, compute the following four quantities related to the entries in that vector:
- The maximum of the entries
- The minimum of the entries
- The average (arithmetic mean) of the entries
- The square root of the sum of the squares of the entries (sometimes called the RMS or root mean square, or in mathematics, the $\ell^2$ norm)
Write these rowwise summary statistics to an output CSV file that has the following header row:
max,min,mean,RMSwhich is then followed by 30 lines, one for each line in the input file.
Once you have a row of the input file converted to a numpy array, there shouldn't be any need for explicit iteration over its entries.
Hint: Reading a row of the CSV in the usual way will give you a list of strings. You need to convert those to floats before asking numpy to create an array out of them.
5. Impact crater (numpy)
Write a function crater(n) that takes a single argument, an integer n, and returns a numpy array of shape (n,n) whose entry at position (i,j) is equal to
$$ \sin \left ( \frac{\pi i}{n-1} \right ) \sin \left ( \frac{\pi j}{n-1} \right ) $$
unless that quantity is larger than 0.7, in which case the entry should instead have the value 0.
Use numpy arrays, and try to avoid loops.
Hint: numpy as the constant $\pi$ built in as np.pi
Here's an example of the expected result for n=8.
# The next line asks numpy to alter the way it prints arrays
# so only three decimal digits are shown, without scientific
# notation.  That will make the next test result easier to
# read.
np.set_printoptions(precision=3,suppress=True)

# Show the 8x8 return value
print(crater(8))
Also, can you explain the name of this problem?
Revision history
- 2021-03-15 - Initial publication